|
|
|
Vesselin C. Noninski New York Sofia Institute, 149 West 12th Street, New York, New York 10011 This letter presents a hitherto unrecognized discrepancy pertaining to only limited number of states in the USA, concerning an essential element of demographics. Said discrepancy is detected upon inspection of the official governmental data1,2 for deaths from all causes. The anomalously high number of all-cause-deaths is observed in only about 12 of all the 50 states of the USA, for the initial 20 weeks of 2020, compared to the uneventful all-cause-deaths toll for the same period in 2018 and 2019. The official data1,2 for the remaining 41 states reveals that no such discrepancy exists during the same period in the same three years, 2018, 2019 and 2020. This new finding has a direct bearing on the purported universal reality of the pandemic claimed in 2020 and deserves special attention. It should be clear that the scientifically unmatched rigorous criterion for anomaly in the health status of a country is the number of deaths from all causes for a given period. Because these data are counted numbers of a final event, the time lag for the acquisition of the latest data notwithstanding, they are ultimately of infinite accuracy and precision, which makes applying statistics of secondary significance, if at all needed, when conclusions are drawn. Also, the official reporting by the government of these raw absolute numbers, subject to no additional processing, statistics or other intervention, makes them free from speculation about their origin and guarantees their unique reliability. Figs. 1 and 2 show a graphic representation of the data provided by the US Center for Disease Control and Prevention1,2 (CDC) for the deaths from all causes in all the 50 states of the United States, as well as, New York City, Puerto Rico and the District of Columbia, for a 20 week period from the beginning of each of the years 2018, 2019 and 2020.
Except for some seemingly borderline cases, it is seen in most of the above figures, that there is a distinct difference between the 2020 curve patterns in Fig.1, compared to 2019 and 2019 curve patterns in the same figure as well as all the curve patterns in Fig.2. Fig.1 shows a surge in 12 of the states of the overall number of deaths in 2020 in the period starting around the 12th week, going through a maximum roughly around the 15th week of year 2020, and still subsiding at the end of the reported period, the 20th week of 2020. On the contrary, in all the graphs shown in this same Fig.1, the 2018 and 2019 curves lack the prominent maximum seen in the 2020 curves. Concurrent with the 2018 and 2019 curves in Fig. 1 is the pattern of all the curves in Fig.2, including the curves for 2020, pertaining to the remaining 41 states of the USA. From Fig.2, it is seen that the 41 remaining states have observed no unusual pattern in the reported data of deaths from all causes, for all the three years, 2018, 2019 and 2020. The data from the two figures can be consolidated and plotted as a single graph for the United States. However, this would conceal the real vast difference in favor of normalcy which the majority of states display compared to only about 25% of all 50 states displaying anomaly. In some cases in Fig.1 there are also some further details in the fine structure of the curves, corresponding to the year 2020, in a direction opposite to that of the 2020 curves containing maximums in Fig. 2. The discussion of these details is deferred to a follow-up study, postponing such discussion for those times, which probably would take several months, when the preliminary data for 2020 would have turned into permanent data, as are the data for the years 2018 and 2019. The main finding of this study; namely, the pronounced difference between the expected curve shapes seen in approximately 75% of states, contrasting to the curves with maximums, seen in the 2020 data for only about 25% of states, is unequivocal even at present. This imbalanced difference is an objective fact based on highly reliable pure raw governmentally provided absolute numbers, devoid of errors and uncertainty due to statistics, predictions and modeling. This notable phenomenon, first reported here, can be seen by practically anyone and needs no peer-review for one to conclude that it is real. The shown unequivocal objective fact must be heeded and explained when honestly analyzing the situation in 2020 in the USA and the world. The above shown is enough to conclude that reconsidering of conjectures and policies therefrom, regarding the alleged 2020 pandemic, must take place without delay. It might be added also, that data for the same period with the trivial pattern similar to the one seen in Fig.2, where no maximum is observed, is provided, for instance, by the National Statistical Institute of Bulgaria3. Exploring the here observed effect in other countries will be left for a future study.
References
|
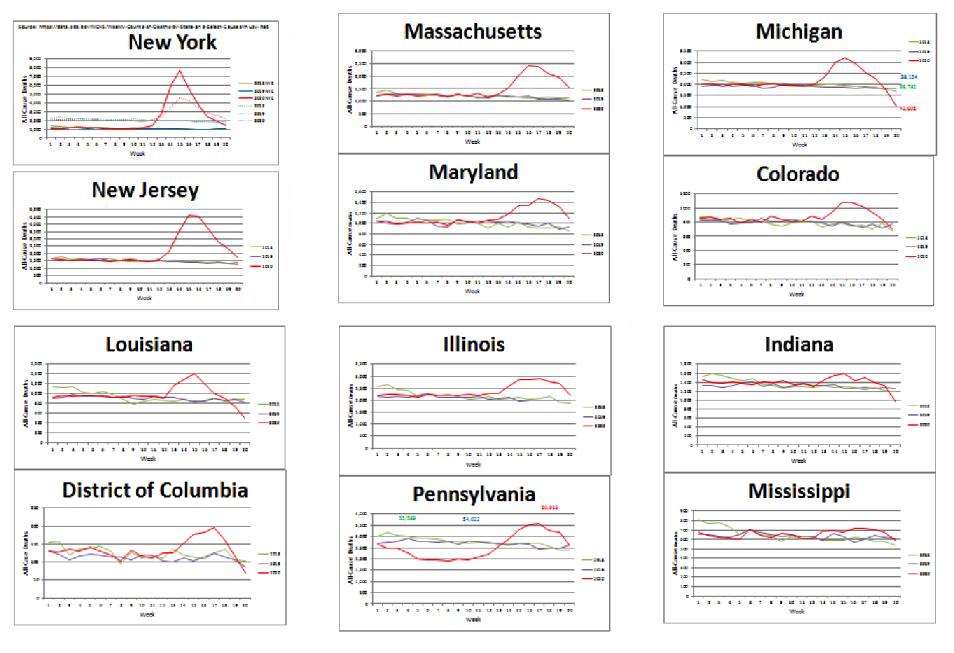 Fig.1. Characteristic maximums seen in the graphs of the 2020 all-cause-deaths in 12 states of the USA
shown on the y-axis, plotted against the week number since the beginning of each year. The red line
refers to 2020, while blue and green lines refer to 2018 and 2019, respectively.
Fig.1. Characteristic maximums seen in the graphs of the 2020 all-cause-deaths in 12 states of the USA
shown on the y-axis, plotted against the week number since the beginning of each year. The red line
refers to 2020, while blue and green lines refer to 2018 and 2019, respectively.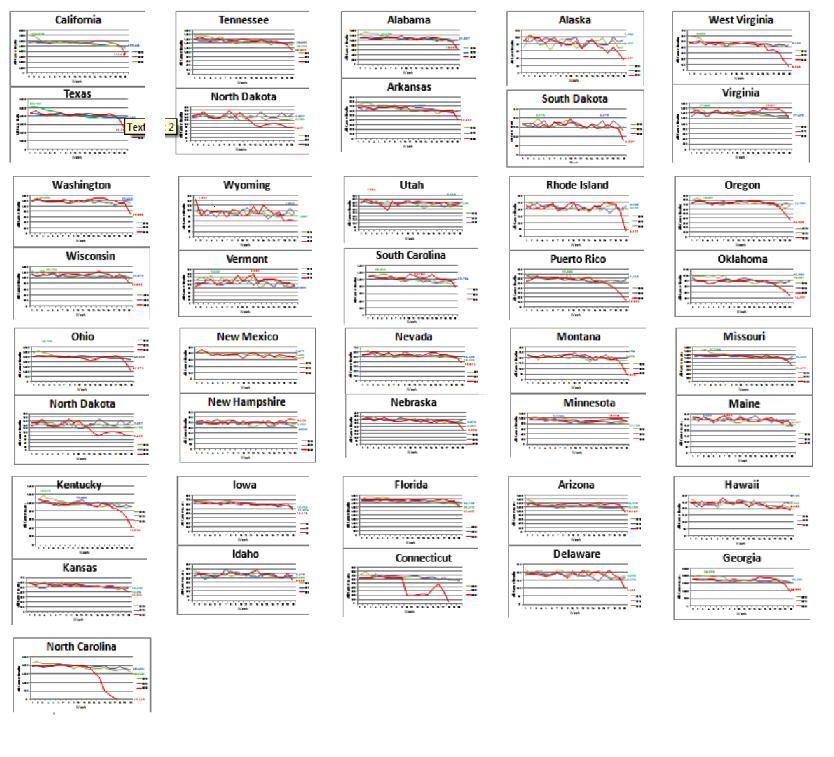 Fig.2. No unusual patterns seen in the graphs of the all-cause-deaths in 41 states of the USA shown
on the y-axis, plotted against the week number since the beginning of each year.
The red line refers to 2020, while blue and green lines refer to 2018 and 2019, respectively.
Fig.2. No unusual patterns seen in the graphs of the all-cause-deaths in 41 states of the USA shown
on the y-axis, plotted against the week number since the beginning of each year.
The red line refers to 2020, while blue and green lines refer to 2018 and 2019, respectively.